
| 1 000 € | 1-6/2025 | 1-6/2024 | Muutos, % | 1‑12/2024 | 1‑12/2023 | Muutos, % |
| Fee Income | 9 798 | 11 532 | -15,0 % | 21 805 | 25 872 | -15,7 % |
| Operating Profit EBIT | 3 511 | 5 318 | -34,0 % | 9 068 | 12 559 | -27,8 % |
| Net Profit | 2 724 | 4 179 | -34,8 % | 7 113 | 9 704 | -26,7 % |
| Operating Profit Margin | 35,8 % | 46,1 % | 41,6 % | 48,5 % | ||
| Cost-to-Income Ratio | 64,2 % | 53,9 % | 58,6 % | 47,7 % | ||
| Equity Ratio | 81,9 % | 80,7 % | 80,3 % | 81,7 % | ||
| Net Debt-to-Equity Ratio | -61,2 % | -63,1 % | -78,7 % | -79,1 % | ||
| ROE | 17,4 % | 22,5 % | 35,5 % | 39,7 % | ||
| Earnings per Share | 0,26 | 0,40 | -34,8 % | 0,69 | 0,94 | -26,7 % |
| Equity per Share | 1,32 | 1,41 | 1,70 | 2,16 | -21,3 % | |
| Average Number of Employees | 72 | 68 | 69 | 69 |
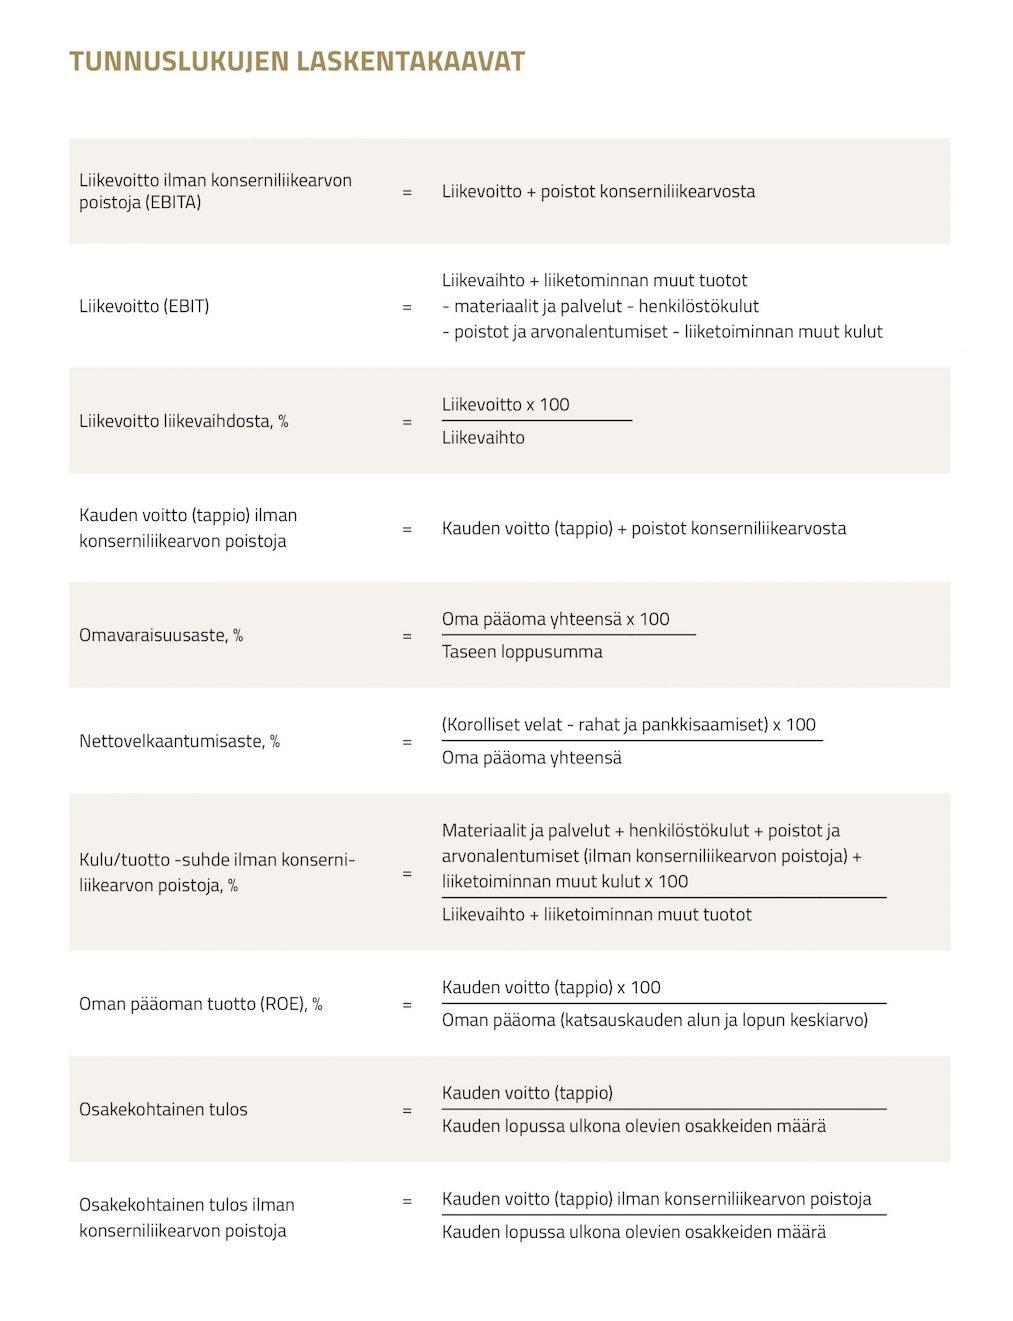
In the company’s view, alternative key figures provide significant additional information regarding the Group to management, investors, securities market analysts, and other stakeholders. They offer insights into the Group’s performance, financial position, and cash flows, and are often used by analysts, investors, and other interested parties.
Pysy ajan tasalla ajankohtaisista uutisista ja tärkeimmistä päivityksistämme. Voit tilata haluamasi sisällöt suoraan sähköpostiisi.